Student Perceptions of the Political Climate on Campus
October 14, 2022
By
John Willis ’23
In a 2021 Viewfinder campus climate survey of 773 W&M students, 25% of respondents stated that they do not feel comfortable expressing their political views. Why might that be?
Professor Jaime Settle and Taylor Carlson ’14 — an assistant professor at Washington University in St. Louis — recently published “What Goes Without Saying: Navigating Political Discussion in America,” a book that explores how people’s social and psychological motivations affect the way they engage in political conversation. They found that individuals frequently opt out of conversations or do not express their genuine views when a conversation might damage their sense of self or their relationships with other people. These normatively undesirable behaviors are especially likely when people perceive that their viewpoints are in the minority. Could this help explain why some W&M students don’t feel comfortable expressing their views?
To shed light on this, our research lab, the Social Networks and Political Psychology Lab at W&M, analyzed data from surveys we’ve collected over the past 10 years that ask students about their political identities as well as their perception of the distribution of political identities among students at W&M.
The Data
The datasets we analyzed are the products of two different surveys, administered multiple times between 2013 and 2022. One is from the Omnibus Project, a research collaboration sponsored by W&M’s Social Science Research Methods Center that facilitates faculty and students in collecting data for their own research projects. The survey has been fielded almost every semester since 2013, and we always ask a standard set of demographic and political questions, including questions about partisan identity. The subjects in this survey — and thus the population to which we can generalize — are students enrolled in classes in the Government Department. We were unable to find reliable national survey data showing the relationship between college major and political views, so we cannot know the extent to which our sample might differ from a more representative sample of W&M students.
The second set of data comes from anonymous surveys that Professor Settle has given to her classes in the Government Department to assess her students’ perceptions of the academic and political climate on campus. Amongst many other topics, these surveys ask students to gauge the proportion of students at W&M who identify as Democrats.
The Distribution of Partisan Identity
The Omnibus Survey asks students to self-identify their partisanship (Democrat, independent, or Republican). Figure 1 shows that a majority of the Omnibus subject pool self-identified as Democrats. This proportion appears to have grown since 2013 to about 65%, after dipping to slightly below 50% in 2015. During the same time, the number of students identifying as independent rose slightly (to just over 25%), while those identifying as Republican declined (to slightly under 10%). We again emphasize that these numbers are not a random sample of W&M students, and we suspect that they are more likely to overestimate the proportion of students who lean left than underestimate it.

Perceptions of the Student Body
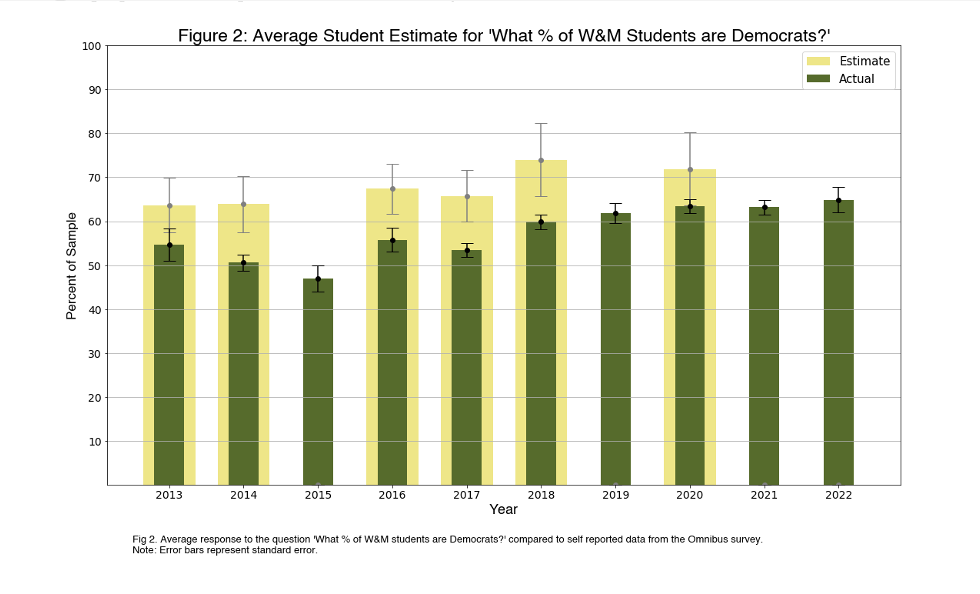
The survey administered to students in Professor Settle’s classes asked “What is your best estimate of the percentage of W&M students who are Democrats?” As shown in Figure 2 below, these estimates range between 63.7% and 74%, although the error bars overlap across the years suggesting there has not been a significant change over time. We cannot explain the jump between 2017 and 2018, but it could relate to a real change in the distribution of viewpoints of the student body, or it could be due to differences in class composition between different years. The figure plots both the estimate of actual student partisanship from the Omnibus sample, in green, and the perception of student body partisanship, in gold. In each year for which we have data, except 2013 and 2020, these statistically significant differences show that students in the sample perceived their peers to be more left leaning than they actually were.
The Bigger Picture
This analysis shows that the student body is likely left leaning, but William & Mary students perceive the campus to be more so than it actually is. These data are not representative of the entire student body and the surveys were not originally designed for this analysis. However, if this pattern were to hold in more generalizable data, it could help explain why some W&M students who took the Viewfinder survey stated that they do not feel comfortable sharing their opinions. Our lab’s research suggests that conversational discomfort often stems from the perception that one’s viewpoint is in the minority or the perception that there may be social costs for expressing one’s opinions. Students’ misperceptions regarding their peers’ political attitudes could discourage the discussion of important political issues.
How do we overcome these challenges to encourage meaningful exchange across lines of difference? The W&M democracy initiative (outlined in the university’s Vision 2026 strategic plan) aspires for the University “to be a place where respectful dialogue takes place on challenging topics.” While laudable, this initiative does not exist in a vacuum. To maximize its potential efficacy, we must better understand the social psychological context in which students find themselves actually engaging in political discussions on a day-to-day basis.
John Willis ’23 is a government major, director of the Omnibus Survey project, and research assistant to Jaime Settle, Cornelia Brackenridge Talbot Associate Professor, Department of Government and Data Science.